Lowtech Monitoring With Jenkins
I mentioned briefly in my previous post that I got quite a few people coming up to me after the panel and asking me for advice on monitoring.
I tweeted about this scenario not long after it happened but here’s the gist:
{% blockquote %} I just need something simple to check on the status of a few jobs and run some SQL statements. I’m a DBA and I can’t get any help from my ops team. {% endblockquote %}
The person who asked this was very friendly and I could sense the frustration in her voice. It frustrates me to no end to hear stories of my tribe being this way to customers.
I thought for a minute because I really wanted to help and the best thing I could think of was Jenkins. Yes, Jenkins.
Reasoning
Let’s look for a minute at what we need from a simple health check system:
- Performing some task on a given schedule
- Ability to run a given command
- Reporting on the output of the given command (success/failure)
Now you might think to your self “Self, this sure does sound a lot like cron”. You’d be right. And that’s EXACTLY what took me down the Jenkins path. There have been numerous posts about people replacing individual cron jobs with a centralized model based on Jenkins. This makes perfect sense and is something of a holy grail. I clearly remember researching and evaluating batch scheduling products many years ago to essentially do just this. If only Jenkins had been around then.
Small disclaimer
While Jenkins is a great low friction way to accomplish this task, it may or may not be scalable in the long run. While Jenkins jobs are defined as XML files and can be managed via an API, it’s still a bit cumbersome to automate.
Getting started
First thing to do is grab the latest Jenkins war. The nice thing about Jenkins is that it ships in such an easy to use format - a self-contained executable war. You can start it very simply with:
java -jar jenkins.war
You should probably click around to get comfortable with the interface. It’s pretty difficult to screw something up but if you do, just shutdown jenkins, rm -rf ~/.jenkins and start it back up.
Since this post is geared primarily at someone who probably isn’t familiar with Jenkins, I’m going to go over a few quick basics and key areas we’ll be working with:
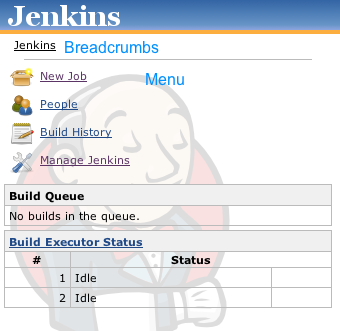
Menus
The menu is the section on the left handside. It will change based on your location in the application. If you don’t always see something you’re expecting, you can use the breadcrumb navigation to work your way back. Alternately, you can click on the Jenkins logo to get to the main page.
Main menu
This is the menu you see from the top-level of the Jenkins interface
Job menu
This is the menu you see when you are viewing the main page of a job
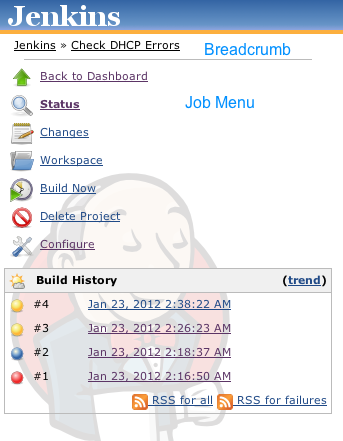
Note the “Build History” section at the bottom. This is a list of all builds that have been performed for this job. You can click on a given build to see details about it.
Build menu
This menu is visible when you select a specific build from the “Build History” menu of a Job page
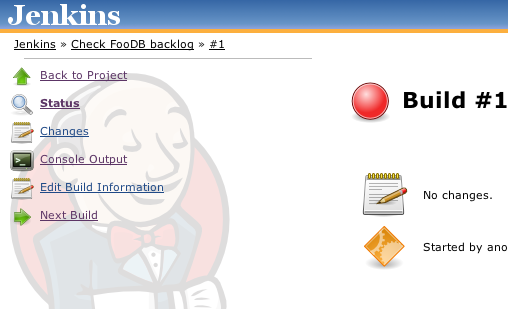
Notice the “Console Output” menu option. This will show you the log of what Jenkins did during a build. If you ever have problems with a build, you should come here and look at what happened.
Auto Refresh
In the interest of eliminating any confusion, we’re going to enable “Auto Refresh” from the link on the top right:

Configuration
For the purposes of this exercise, we won’t do too much configuration. We’re going to take the perspective of the person above. We’ll make few assumptions though in the interest of expidiency:
- The user has no passphrase on the SSH key. While this is probably not true, it makes this demo easier.
- The DB test will be executed locally.
- The local environment is some unix-y/linux-y one. The environment for this post was OS X communicating with Linux VMs
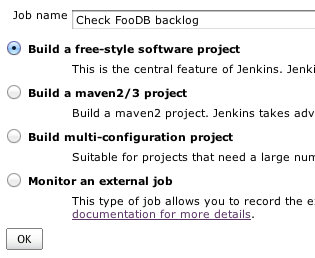
The key to success here is something called a “free-style software project”. This is essentially a blank canvas with very few requirements. I’m aware that the “Monitor an external job” type has been recently added but the steps were a bit too invasive for this particular case.
Our test case
I don’t obviously have the specifics of what the user wanted checked so I’m going to extrapolate from her original statement:
- Run a SQL statement to see if some record is found
- Check for a running process
- Check a log file for some given string
The test database
The test database will be MySQL running on a Linux VM. Getting this going is an exercise for the reader, however here is the DDL and test data we’re using:
--- This is just a sample, folks. Yes I know it's insecure.
create database foo_db;
use foo_db;
create table jobs ( id int not null auto_increment primary key, name varchar(10), depth int);
insert into jobs (name, depth) values ("job_a", 100);
insert into jobs (name, depth) values ("job_b", 0);
insert into jobs (name, depth) values ("job_c", 5);
grant select on jobs to 'jenkins'@'%' IDENTIFIED BY 'password';
flush privileges;
First Job
So we’ll create a new freestyle job called “Check FooDB Backlog”. Click on “New Job” from the main menu.
Once you’ve created the job, the screen gets a bit more hectic. We’re only going to concern ourselves with a few key areas:
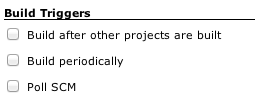
Build Triggers {% img right /images/posts/lowtech-monitoring-with-jenkins/build-triggers.png %}
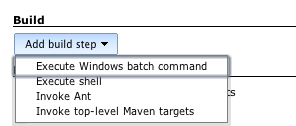
Build Steps {% img right /images/posts/lowtech-monitoring-with-jenkins/build-step.png %}
I’ll frequently refer to the
?icon. {% img right /images/posts/lowtech-monitoring-with-jenkins/help-icon.png %}
Scheduling
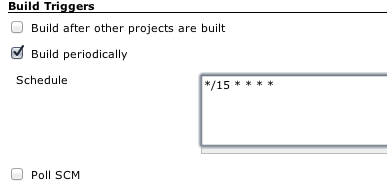
Under build triggers, we want to use the “Build Periodically” option. The syntax is akin to cron and there are some additional macros for known intervals. As with any Jenkins option, you can click on the ? icon to the right of the option for inline help.
So we’re going to set up our health check to run every 15 minutes:
Defining the Build Step
Through Jenkins plugins, you can get an insane amount of additional build steps. However, the shipped experience has the stuff we need for now. We’re going to be using the “Execute Shell” option. If you are running Jenkins on Windows, you’ll want to use the “Execute Windows Batch command” instead. You will, of course, need to modify the commands appropriately yourself.
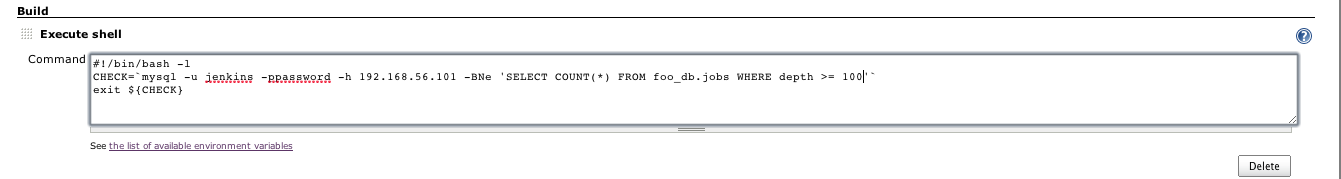
Here’s the body of our build step:
#!/bin/bash -l
CHECK=`mysql -u jenkins -ppassword -h 192.168.56.101 -BNe 'SELECT COUNT(*) FROM foo_db.jobs WHERE depth >= 100'`
exit ${CHECK}
Running the job
Once you click save, you can click “Build Now” on the job menu to give it a test. It should fail:

Let’s modify the job so we can see what success looks like. Click on the “Configure” link in the build menu and modify your build step. Set the threshold in the query to 101. The build should now be blue:

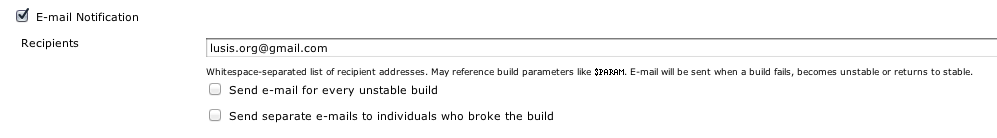
This all works very well if you just want to manually inspect the status however let’s take it a step further. Click on the “Configure” link from the Job menu. Notice at the bottom of the following screen, there’s a section called “Post-build Actions”. The very last option is “E-mail Notification”. You can click the ? to see the default behaviour. Check the box and add your email address:
Getting Notified
Sadly, this isn’t enough to enable email notifications. You’ll need to tell Jenkins an SMTP server it can use. Go back to the main menu and click “Manage Jenkins”.
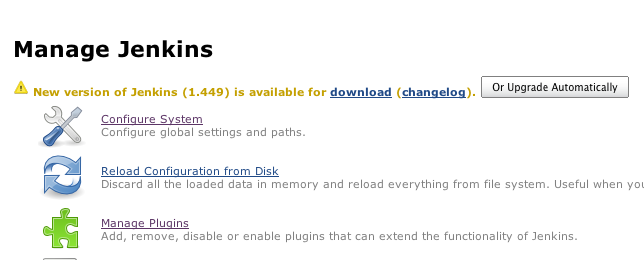
From here, we’re going to click “Configure System”
Another busy screen! The settings in this section can get you in trouble if you aren’t careful. The most common problem is people attempting to enable security and inadvertently locking themselves out. We’re not worried about that for now. Scroll to the bottom and configure your SMTP server. The settings shown are for gmail and you’ll need to click the “Advanced” button to enable additional settings.
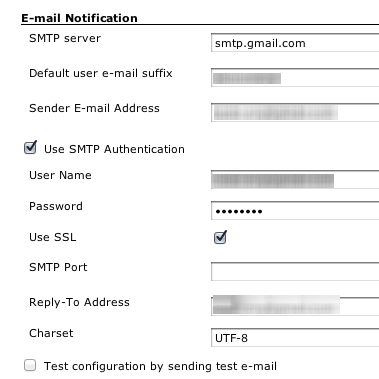
You can select the last checkbox to test that your settings work.
Once that’s done, click save. Now we’re going to rerun the job (Go back to the main menu then click your job from the list to see the “Build Now” option in the job menu. You most likely won’t get an email because the job is passing. Let’s configure our job again and set the threshold back to 100. Save the job and click “Build Now” again from the job menu.
You should get an email that looks something like this:
Subject: Build failed in Jenkins: Check FooDB backlog
See <http://localhost:8080/job/Check%20FooDB%20backlog/8/>

------------------------------------------
Started by user anonymous
Building in workspace <http://localhost:8080/job/Check%20FooDB%20backlog/ws/>
[workspace] $ /bin/bash -l /var/folders/d6/h7dxb_zj49s8xlj91zd3z6fr0000gn/T/hudson1906255485094144268.sh
Build step 'Execute shell' marked build as failure
There’s not much information in there since our job is swallowing the mysql output and using it as the exit code. You can spice the output however you like it by adding echo statements to the build step. Any output from the job will be included in the email. If you change the thresholds back to a value that you know will pass, you’ll get at least one email when the build recovers. Unless the build starts failing again, you won’t get any emails.
Subject: Jenkins build is back to normal : Check FooDB backlog
See <http://localhost:8080/job/Check%20FooDB%20backlog/9/>
Second Job
So now we’ve got something handling our DB test. We also needed to check to see if some process was running. Let’s do a simple one to see if MySQL is running. Let’s call it “Check MySQL Running”. Follow the steps for creating a free-style job but this time we’re going to create our build step like so:
#!/bin/bash -l
ssh 192.168.56.101 'ps -ef' | grep mysqld
Again, we’re going to assume that SSH keys are setup with no password. We’re keeping it simple. Just as in the case of the other job, we should get a blue build status.
Third Job
The third job is the most complex in that we’re going to need to install a plugin for maximum effect. This will have you jumping around a bit but hopefully you’re a bit more comfortable navigating by now. At a high level we’re going to do the following:
- Install a new Jenkins plugin
- Create a new job
- Take note of a new build option
- Configure the plugin globally
- Enable the plugin in our job
Installing a Plugin
We’re going to go back to “Manage Jenkins” (accessible from the main menu) but now we’re going to select “Manage Plugins”.
Once on the plugin screen, click the “Available” tab. This part can be overwhelming. It’s especially confusing since plugins will be listed twice if they fall into multiple categories. However, you only need to mark it once.
The plugin we want is called the “Log Parser Plugin”. If you can’t easily find it, use your browser’s “find on page” (CTRL-F, APPLE-F) to find it.
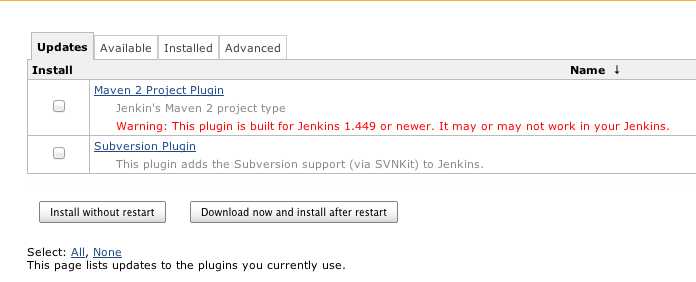
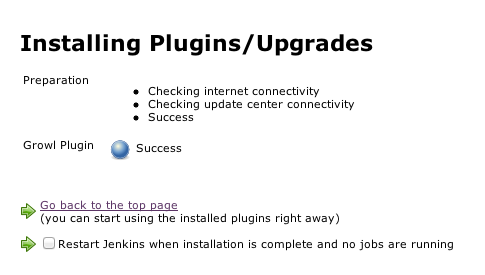
Check the box and click “Install without Restart”. You should see a screen similar to this:
Back to the job
Now let’s create our final job. Following the same steps as above, create a new job called “Check DHCP Errors”. Again, reaching for a contrived case, I’m going to check my VM’s syslog to see if it had any errors related to DHCP.
#!/bin/bash -l
ssh 192.168.56.101 'tail -n 5 /var/log/syslog'
Now we could have done this with a grep statement just like above. However I wanted to show installing plugins and the “Log Parser Plugin” actually offers some more flexible options, understands more than just pass or fail and can match multiple items without building overly complex flow into your shell step.
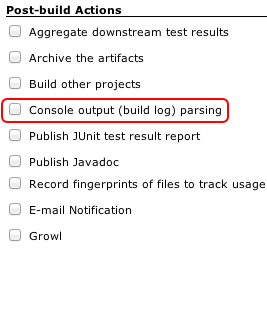
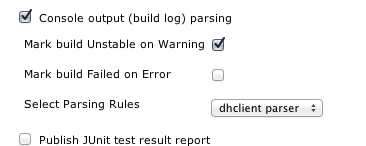
You’ll notice at the bottom we now have an ADDITIONAL option in our “Post-build Actions” - Console output (build log) parsing:
Whenever you install a plugin, where it’s used depends on what it does. In this case, we’re doing post processing of the job run log. We can add a third state via this plugin as opposed to just “Pass” or “Fail” - “Unstable”. Before we can enable it, however, we need to give it some parsing rules.
For now leave the option unchecked and click “Save”
Configuring the new plugin
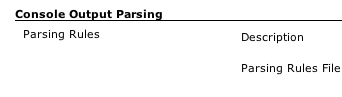
Go back to the “Manage Jenkins” screen (where you set the Email settings). At the bottom, you should now have an option for Console Output Parsing:
Again, anything you configure in this section is GLOBAL. Luckily you can define various rule sets for parsing and apply them individualy to jobs. This plugin is a bit complex so you’ll probably want to look at the documentation.
We’re going to create a very basic rules file in /tmp on our LOCAL machine (where Jenkins is running) called jenkins-dhclient-rules:
warn /^.*dhclient: can't create .*: No such file or directory$/
info /^.*dhclient: bound to .*$/
This is telling the log parser that the following line is a “warning”:
Jan 23 01:49:52 ubuntu dhclient: can't create /var/lib/dhcp3/dhclient.eth1.leases: No such file or directory
and that
Jan 23 01:49:52 ubuntu dhclient: bound to 192.168.56.101 -- renewal in 1367 seconds.
is informational. These distinctions are handy for the plugin’s colorized output support.
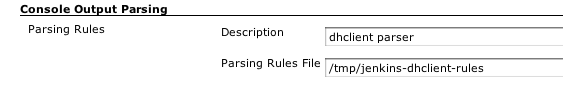
Now that we’ve created that file, under the plugin settings we want to name it and give it the location to the file:
Back to our job
Finally!
Let’s go back to our new job (Check DHCP Errors) and modify it. We want to enable the parsing plugin in the post-build steps. We’re going to check “Mark build Unstable” for warnings and select our rule. Now save the job. The reason we’re going for warning is that this error is not fatal. Our system still gets an IP address. What we want to do is draw attention to it.
Now if you run the job, you’ll get a yellow ball indicating that the job is unstable. If we were to change the first line of our rule to error and check the appropriate box, the job would have been marked a failure. Something additional this plugin provides is the “parsed console output”. If you click on the job detail and select “Parse Console Output” from the job menu, you’ll actually get a nicer way to see exactly what was wrong:
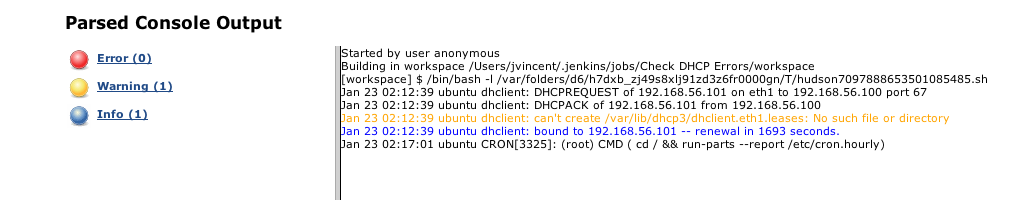
Again, this is a totally contrived example. Obviously we would fail long before the parsing had the host been down.
Tying it all together
All of these individual jobs are neat but there’s an obvious dependency there. We need to be able to SSH to the host, we need mysql to be running and then we want to query it. We don’t want multiple emails for each failure. We only want the actual failed job to alert us. Let’s chain these jobs together to match that flow.
- Under the “MySQL Running” and “FooDB” jobs, disable the cron schedule. We only want it on the “DHCP” job.
- Under the DHCP job, we’re going to select the Post-build step of “Build other projects”
- Check “Trigger even if build is unstable” since we know it’s going to be unstable.
- In the text area, we want to add our “Check MySQL Running” job
- Under the “Check MySQL Running” job, we want to select “Trigger only if build succeeds” and set our text area to the “Check FooDB Backlog” job.
Now if you run the top-level job (Check DHCP Errors), all of the jobs will run. If any fail, the run will stop there and alert you! Since this is now scheduled, every 15 minutes this entire workflow will be checked.
Additional plugins and tips
Jenkins has a boatload of plugins. It’s worth investigating them to see if they make some given task (like output parsing) easier. Some provide additional notification paths like jabber or irc. Others provide additional build step types in specific languages like Groovy or Powershell. You can also do things like create a “Parameterized Build”. This is especially handy for thresholds. There’s also a very handy SSH plugin that let’s you define hosts globally and keys per host. This helps clean up your build steps too.
One plugin that was recommended is the “Email-ext” plugin. This allows you to REALLY spice up and configure your email notifications.
There’s a plugin for checking a web site for some criteria and plugins for starting virtual machines. There are also plugins for creating a radiator view so you can get a nice big dashboard for just checking the state of jobs at a glance.
The key to remember is that Jenkins is an unopinionated build tool. This flexiblity lends itself to doing off-the-wall stuff (like being a monitoring system or a cron replacement). The trick is translating the concepts and terminology of building software to something that fits your use case.
Additional Credits
I’d like to thank Joe Miller, Ches Martin and R. Tyler Croy for reviewing this post and offering up corrections, tips and advice.